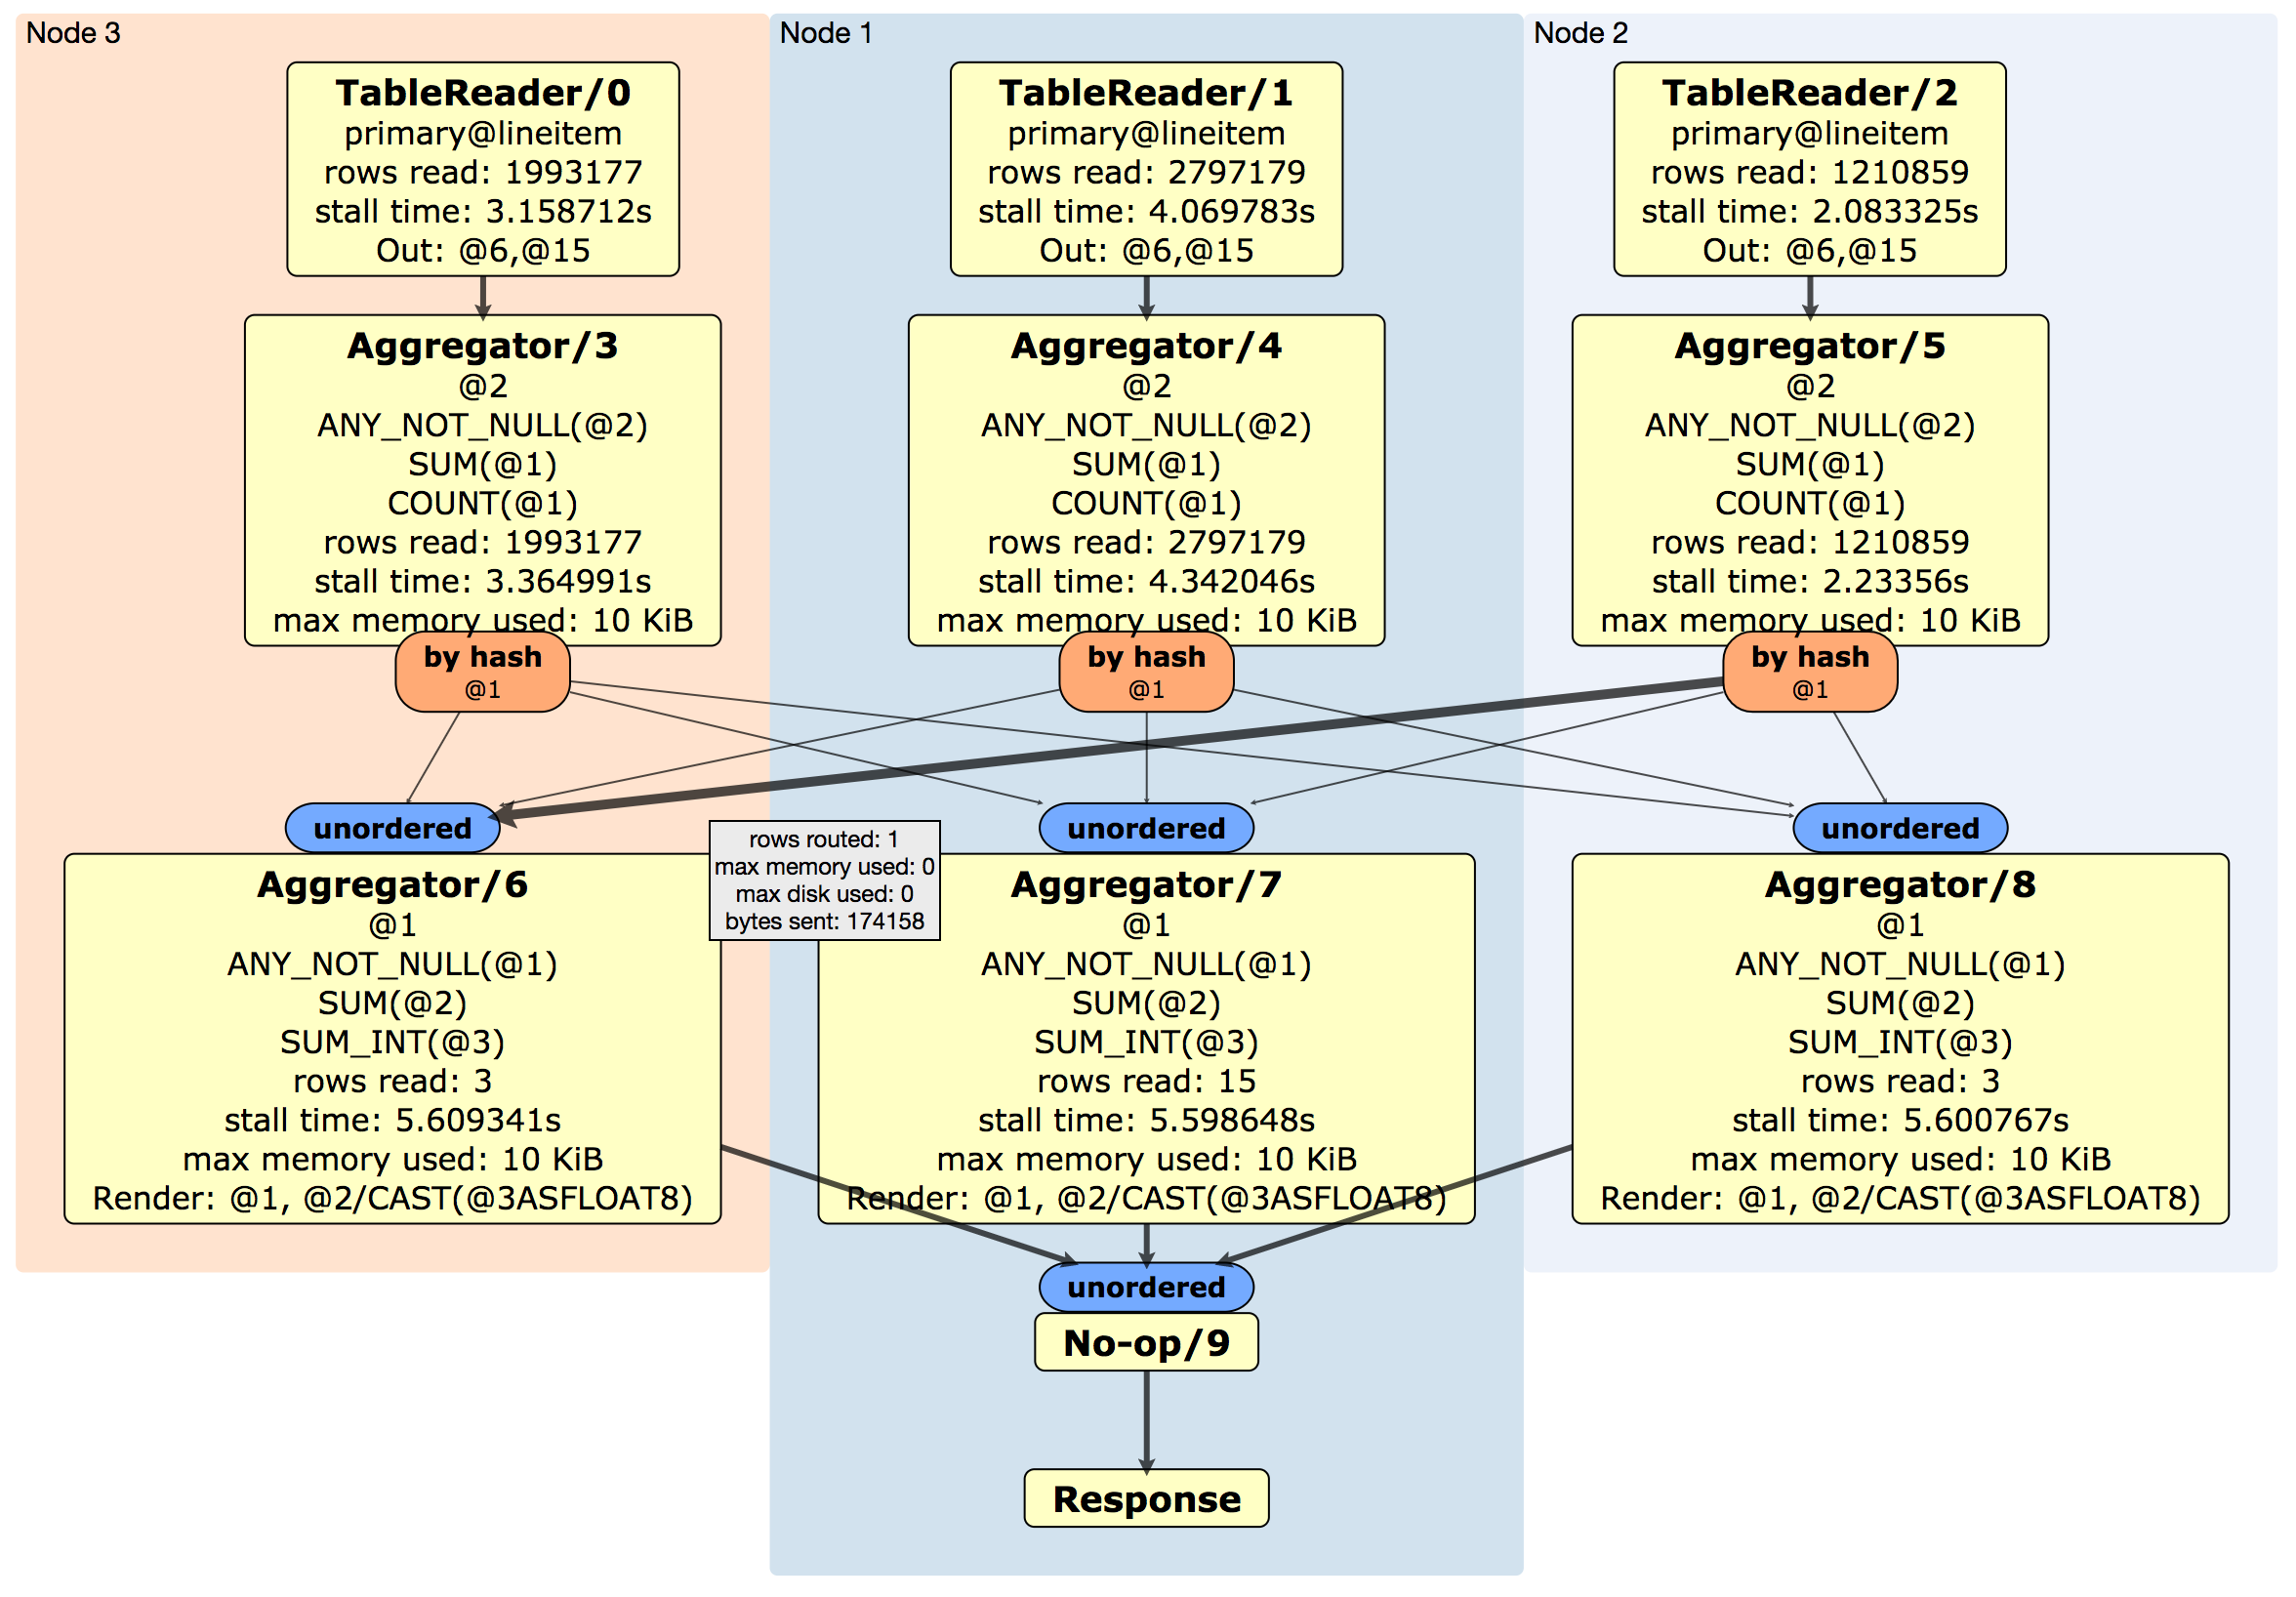
The EXPLAIN ANALYZE statement executes a SQL query and generates a URL for a physical query plan with execution statistics. Query plans provide information around SQL execution, which can be used to troubleshoot slow queries by figuring out where time is being spent, how long a processor (i.e., a component that takes streams of input rows and processes them according to a specification) is not doing work, etc. For more information about distributed SQL queries, see the DistSQL section of our SQL Layer Architecture docs.
The physical query plan is encoded into a byte string after the fragment identifier (#) in the generated URL. The fragment is not sent to the web server; instead, the browser waits for the web server to return a decode.html resource, and then JavaScript on the web page decodes the fragment into a physical query plan diagram. The query plan is, therefore, not logged by a server external to the CockroachDB cluster and not exposed to the public internet.
Synopsis
Required privileges
The user requires the appropriate privileges for the statement being explained.
Parameters
| Parameter | Description |
|---|---|
DISTSQL |
(Default) Generate a link to a distributed SQL physical query plan tree. |
preparable_stmt |
The statement you want details about. All preparable statements are explainable. |
Success responses
Successful EXPLAIN ANALYZE statements return a table with the following columns:
| Column | Description |
|---|---|
| automatic | If true, the query is distributed. For more information about distributed SQL queries, see the DistSQL section of our SQL Layer Architecture docs. |
| url | The URL generated for a physical query plan that provides high level information about how a query will be executed. For details about reading the physical query plan, see DistSQL Plan Viewer. The physical query plan is encoded into a byte string after the fragment identifier ( #) in the generated URL. The fragment is not sent to the web server; instead, the browser waits for the web server to return a decode.html resource, and then JavaScript on the web page decodes the fragment into a physical query plan diagram. The query plan is, therefore, not logged by a server external to the CockroachDB cluster and not exposed to the public internet. |
DistSQL Plan Viewer
The DistSQL Plan Viewer displays the physical query plan, as well as execution statistics:
| Field | Description |
|---|---|
| <ProcessorName>/<n> | The processor and processor ID used to read data into the SQL execution engine. A processor is a component that takes streams of input rows, processes them according to a specification, and outputs one stream of rows. For example, an "aggregator" aggregates input rows. |
| <index>@<table> | The index used. |
| Out | The output columns. |
| @<n> | The index of the column relative to the input. |
| Render | The stage that renders the output. |
| unordered / ordered | (Blue box) A synchronizer that takes one or more output streams and merges them to be consumable by a processor. An ordered synchronizer is used to merge ordered streams and keeps the rows in sorted order. |
| left(@<n>)=right(@<n>) | The equality columns used in the join. |
| rows read | The number of rows read by the processor. |
| stall time | How long the processor spent not doing work. This is aggregated into the stall time numbers as the query progresses down the tree (i.e., stall time is added up and overlaps with previous time). |
| stored side | The smaller table that was stored as an in-memory hash table. |
| max memory used | How much memory (if any) is used to buffer rows. |
| by hash | (Orange box) The router, which is a component that takes one stream of input rows and sends them to a node according to a routing algorithm. For example, a hash router hashes columns of a row and sends the results to the node that is aggregating the result rows. |
| max disk used | How much disk (if any) is used to buffer rows. Routers and processors will spill to disk buffering if there is not enough memory to buffer the rows. |
| rows routed | How many rows were sent by routers, which can be used to understand network usage. |
| bytes sent | The number of actual bytes sent (i.e., encoding of the rows). This is only relevant when doing network communication. |
| Response | The response back to the client. |
Any or all of the above fields may display for a given query plan.
Example
EXPLAIN ANALYZE executes a query and generates a link to a physical query plan, with execution statistics.
> EXPLAIN ANALYZE SELECT l_shipmode, AVG(l_extendedprice) FROM lineitem GROUP BY l_shipmode;
  automatic |                      url
+-----------+----------------------------------------------+
    true    | https://cockroachdb.github.io/distsqlplan...
To view the DistSQL Plan Viewer, point your browser to the URL provided:
